One day in the life of my blog.
Yesterday I inserted the code that Statcounter gave me so that I can track site visitors. Tons of interesting information and graphs.
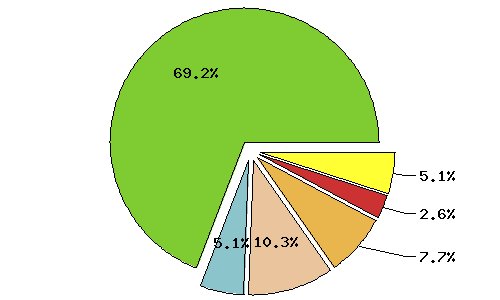
This pie chart shows the percentage of visitors who stayed for varying lengths of time.

| Visit Length | |||
| 25 | Less than 5 secs | ||
| 2 | From 5 secs to 30 secs | ||
| 4 | From 30 secs to 5 mins | ||
| 3 | From 5 mins to 20 mins | ||
| 1 | From 20 mins to an hour | ||
| 2 | Longer than an hour |
Other information was that I had 67 visitors yesterday and the most visited page was my write up of the technology2.0 event with 25 visits. The most used search expression was pees on earth. With 9 out of 13 using google for search. 69% of visitors were from the UK and 31% from the USA. 33% used Firefox and 55% using IE
However, the free version only tracks 100 visits, should I upgrade!


2 Comments:
Or use Google Analytics, which is free and unlimited (from what I can tell). I've got similar stats from that, and it works quite well.
I use Statcounter too, and like it, but I often wonder how many readers I have who just read the RSS feed, which it won't measure, I don't think. If people click from the feed to the actual blog, you'll get 'em....
Post a Comment
Links to this post:
Create a Link
<< Home